The BUSCO completeness check assesses the completeness and quality of a genome, transcriptome or proteome assembly by searching for highly conserved single-copy orthologues that should be present in a given lineage. By providing datasets for specific taxonomic lineages, BUSCO helps assess evolutionary completeness. In a previous post l gave you some insights into the frequently observed higher rate of duplicates in annotations compared to assemblies. Here, I will discuss the curious observation that the rate of fragments is usually considerably smaller in assembly mode compared to annotation mode.
It seems paradoxical that a quick, low-resolution genome annotation such as the BUSCO assembly mode would produce fewer fragmented genes than a comprehensive, evidence-based annotation. In assembly mode up to version 5.0, BUSCO used AUGUSTUS-PPX with OrthoDB alignment blocks, applying pre-existing species parameter profiles without any training or additional evidence, which by definition should yield weaker predictions than a full annotation pipeline that includes species-specific training and extensive EST or RNA-seq support. Since version 6.0 BUSCO uses miniprot, which does not perform de novo gene prediction but instead maps reference sequences to the genome as far as possible. If reference sequences contain incorrect or incomplete regions, these segments either fail to map or align to unrelated genomic locations, for example regions outside the actual gene. The screenshot illustrates this problem: for the example gene shown, none of the OrthoDB reference sequences includes the N-terminal region present in the RNA-seq–based annotation. Instead, they contain segments that map to a gene located four genes downstream, which is even annotated on the opposite strand. Consequently, none of these genes should be labeled “complete,” since this suggests to users that an intact gene was fully recovered at a given locus, aside from possibly a few terminal amino acids.
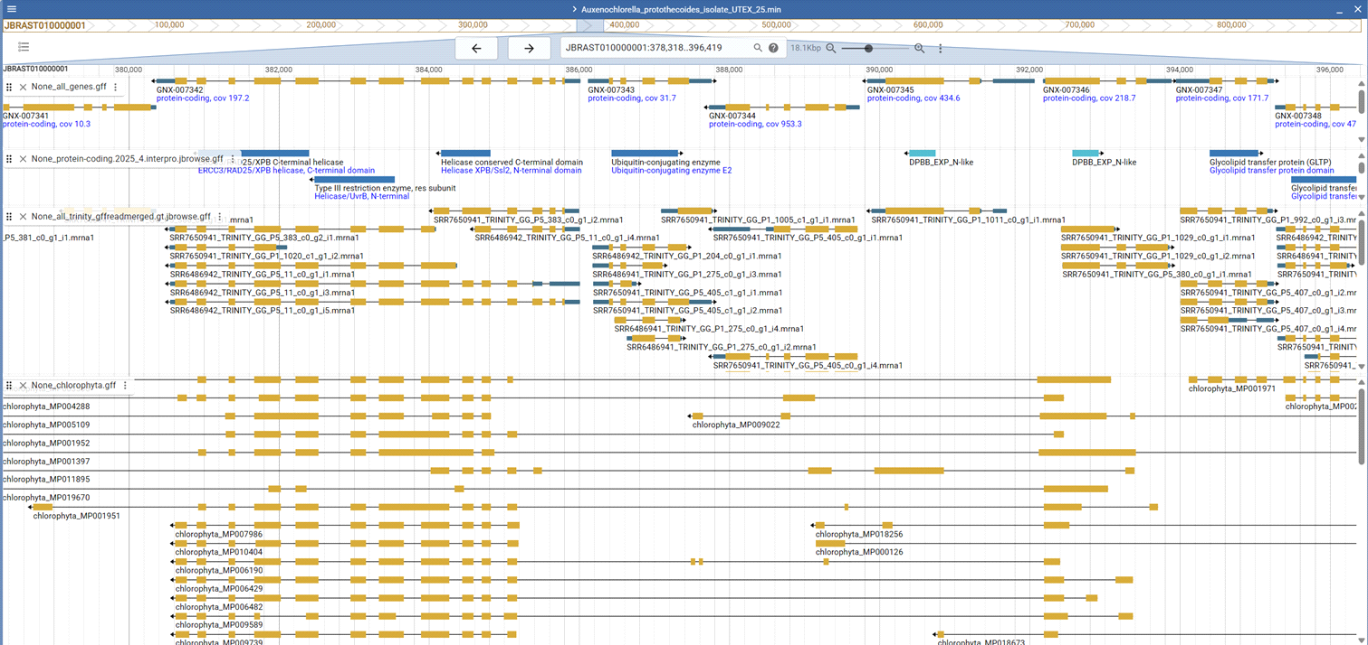
Figure legend: Genome annotation of a green alga. The top tracks display the genome annotation, the middle track shows an independent transcriptome assembly mapped to the genome, and the bottom track shows BUSCO sequences aligned with miniprot.
In assembly mode, BUSCO does not have access to the true gene sequence. To classify a gene as “complete” or “fragment,” it calculates the fraction of the reference sequence that miniprot successfully maps. As a result, even a sequence only half the length of other references can be labeled “complete” if miniprot maps it fully.
In protein mode, completeness is judged against the HMM profile built from the reference sequences. A protein is labeled “complete” when it matches or exceeds the HMM length. In assembly mode, a predicted gene can be much shorter than the HMM length and still count as “complete” if miniprot maps at least 80 percent of the reference sequence to the genome. Because miniprot forces the reference to map somewhere in the genome (see example in the screenshot), the fraction of fragments in assembly mode is always very low. In contrast, the HMM profiles usually reflect the full length of the longest reference sequences rather than only their conserved cores. If they were trimmed to conserved regions, BUSCO would no longer assess gene completeness but only the presence of core motifs. Since terminal regions vary strongly in sequence and length, genome-annotated proteins often match the HMM profiles only partially even when fully supported by RNA-Seq evidence.
Conclusion
In summary, the much higher number of fragments in protein mode compared to assembly mode results from the fact that each mode relies on a different reference to define a full-length gene. This is a technical difference in methodology rather than a biological effect. Consequently, comparing the proportions of complete and fragmented BUSCOs between the two modes is essentially an apples-to-oranges comparison.