In publications reporting on new genome assemblies, the mean GC-content — the proportion of guanine (G) and cytosine (C) bases in a genome — is almost always given in the section summarising the assembly statistics such as the number of assembled scaffolds, the scaffold length statistics and the GC calculations. The descriptions read similarly to the following, which was recently published (J Höglund , G Dias , RA Olsen , A Soares , I Bunikis , V Talla , N Backström (2024) Genome Biology and Evolution, 16, evae031):
“The mean GC content was 37.8 %, and nucleotide composition was stable across all chromosomes.”
These descriptions are intended to emphasise that the mean GC represents a general genomic signature and that the stability across chromosomes suggests that there are no major biases or abnormalities due to assembly problems or contamination. But is this really the case?
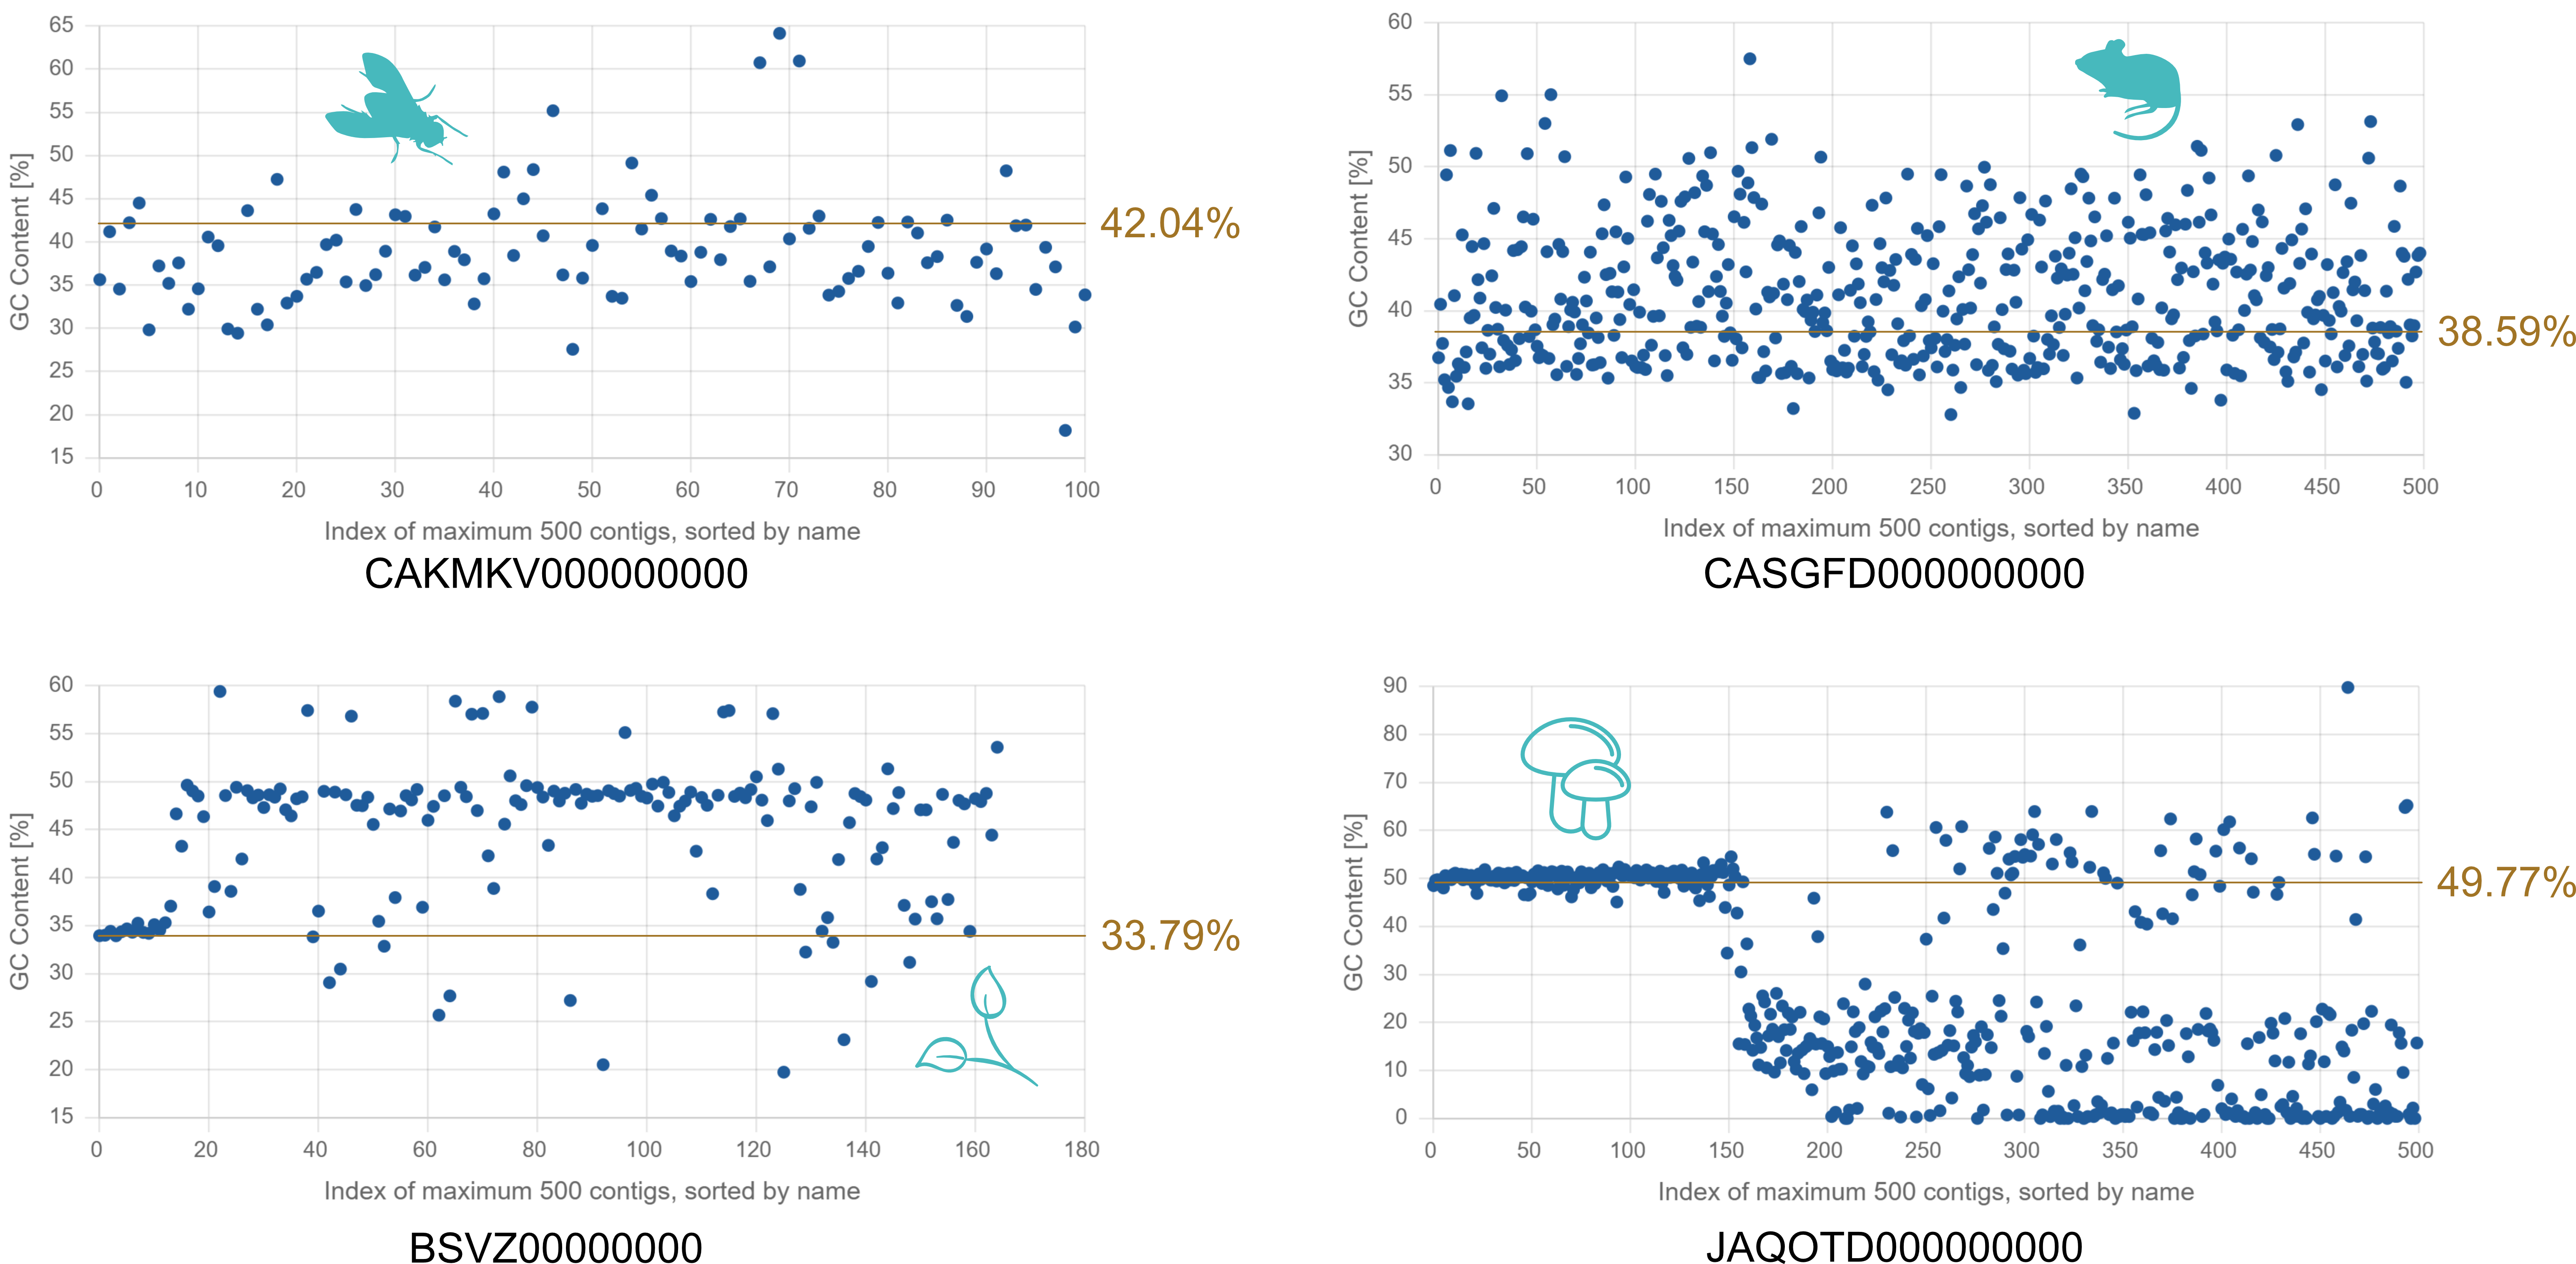
GC content is analysed because it provides valuable information about both the biological characteristics of the genome and the technical performance of the sequencing and assembly process. Eukaryotic genomes often exhibit heterogeneous GC content, with regions of high and low GC content associated with differences in gene density, distribution of regulatory elements and chromatin structure. For example, gene-rich regions in vertebrates tend to be GC-rich. However, these local variations are completely averaged out in the single mean GC content over the entire assembly. In contrast, inspection of smaller contigs prior to high-level scaffolding shows that GC content often varies between contigs with 0-10% to 90-100%. When comparing the GC content between related species, the values scatter over large ranges, if not over the entire spectrum from very low (10-20%) to very high (80-90%) GC. From a biological point of view, the GC content is therefore just another number for a genome assembly, like the genome size or the number of chromosomes.
From a technical perspective, sequencing technologies and assembly algorithms can struggle with regions of extreme GC content, resulting in biased coverage or incomplete assembly. By reporting GC content, researchers can assess the quality of the assembly and detect anomalies such as contamination or underrepresented regions. But does the mean GC content of the whole assembly help detect local anomalies? There is an interesting recent study that sheds some light on this issue (J. Kim et al. (2022) Genome Biology, 23, 204). Many previous genome assemblies based on short-read sequencing have proven to be incomplete and error-prone. The Vertebrate Genomes Project (VGP) addresses these issues by creating more accurate and complete reference genomes using long-read sequencing, advanced scaffolding, improved algorithms and manual curation. In the study, new VGP assemblies were compared with earlier versions for several vertebrate species. It was found that up to 11% of the genomic sequence was missing in older assemblies. Which sequence regions are affected? The authors found that ‘the higher the GC or repeat content, the more missing sequence in the earlier assemblies’. The missing sequences in older assemblies disproportionately affect the GC-rich promoter and exon regions, leading to structural or sequence errors in 26-60% of genes, which can lead to misinterpretation of function.
Conclusion
From a biological point of view, the mean GC content for a genome assembly is nothing more than a number. From a technical point of view, the mean GC content cannot reveal local anomalies. Even if 10 or 20 % of all GC-rich regions were completely missing, the mean GC content of a genome assembly of the size of an animal would not change to a value that would surprise the analyst. Analysing and discussing GC content in genome assembly studies is only useful when comparing different assemblies of the same data or local homologous regions in assemblies of related species.